Spin polarized calculations
Contents
1 Kohn-Sham wavefunctions of a CO molecule
For the calculation of the CO molecule, we use an electronic temperature of 0.01eV, which is significantly lower than the temperature, which is typically used for bulk or slab calculations. For molecules one has to choose the electronic temperature such that there are no partially occupied states. Thus for a molecule with a small bandgap, the electronic temperature has to be small. For the case of CO, the bandgap is large and thus the choice of electronic temperature is not critical.
As we have an isolated molecule surrounded by vacuum in the unit cell, we only need to sample one k-point, the gamma point located at the origin of the reciprocal unit cell.
In this section, we will look at the Kohn-Sham wavefunctions of the CO molecule and compare them to results from molecular orbital theory. The CO molecule has 10 valence electrons, and thus the lowest five bands are occupied and the higher bands are unoccupied. This can also be seen from the DFT calculation by using the command:
grep EIG out_CO.txt
where "out_CO.txt" is the ASCII output file for the CO molecule.
The molecular orbital scheme of the CO molecule is
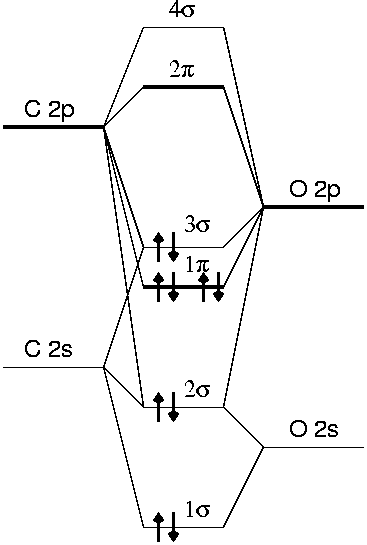
You can plot the molecular orbitals of the CO molecule with the script CO_wavefunction.py.
This script is used with the command:
python -i plotwavefunction.py <bandno>
where <bandno> is replaced by the number of the band which should be plotted. In the NetCDF output file, the bands are numbered with the band lowest in energy being band no. 0. Plotting the 8 lowest bands one obtains the CO molecular orbitals
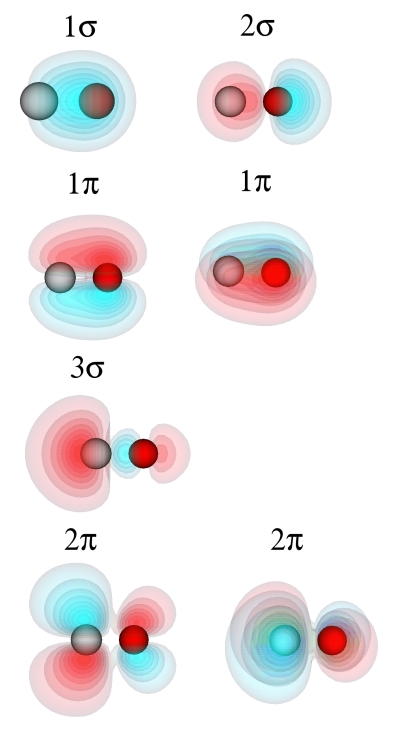
Note that the 1π and 2π orbitals are twofold degenerate. Their wavefunctions have the same shape, but are orthogonal to each other.
The Kohn-Sham orbitals resemble the orbitals obtained by molecular orbital theory. A priori, the Kohn-Sham orbitals do not have any physical meaning, as they are constructed as a noninteracting reference system which has the same electron density as the real interacting system. In many cases, however, the Kohn-Sham orbitals have physical meaning, as we see here for a CO molecule.
The highest occupied molecular orbital (HOMO), the 3σ orbital, is a largely nonbonding orbital located on the carbon atom. This corresponds to the lone pair of electrons at the carbon atoms. The lowest unoccupied molecular orbital (LUMO) is a degenerate pair of orbitals, which are predominantly located at the carbon atoms. From the phase of the wavefunctions one can see that the 1σ orbital is bonding, the 2σ orbital antibonding, the 1π orbitals bonding, the 3σ orbital largely nonbonding and the the 2π orbitals antibonding.
2 Electron spin: Fe(bcc)
In this exercise, we calculate Fe in the bcc crystal structure with spin-polarized calculations. We use the experimental lattice constant a = 2.87 Å throughout. The atomic term of iron is [Ar]3d64s2, i.e. 8 valence electrons/atom is included in the calculation.
The magnetic moment of an isolated Fe atom is caused by unpaired electrons which contribute a magnetic moment of one Bohr magneton μB each. Hund's rule says that the orbitals should be populated such that the number of unpaired electrons is maximal. This leads to the following scheme
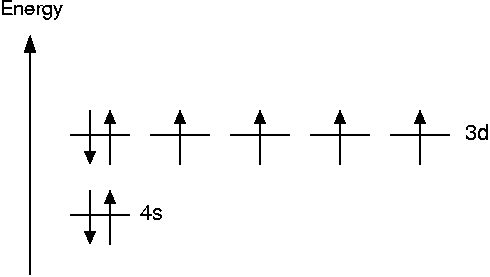
Thus the magnetic moment of an unpaired electron is 4 μB. In the bulk, however, part of this magnetization is canceled by the delocalization of the electron density. The experimental value for the magnetic moment of bulk iron is 2.22 μB.
Assuming maximum polarization, we need six electronic bands per atom ( one s-band and five d-bands). We have two atoms in the unit cell and need five extra bands, so in total we need 2*6+5=17 bands in our calculation.
For the initial magnetic moment, we provide a start magnetic moment of around 2.22. If we did not know the experimental value of the magnetic moment in the bulk, we could also use the value for an isolated atom, 4, as a starting guess. The calculation would just take slightly longer to converge. Thus, for the ferromagnetic calculation, we set the inital magnetic moment of both atoms to be 2.2, for the antiferromagnetic calculation to 2.2 and -2.2 and for the nonmagnetic calculation both 0.0. The used scripts are Fe-ferro_compl.py, Fe-anti.py and Fe-non.py.
We obtain the following energy differences for the different magnetic structures. All energies are calculated relative to the energy for the ferromagnetic structure. The energies are given in eV and are per unit cell, i.e. per two Fe atoms. As it can be seen in the Python scripts, they have been obtained with an energy cutoff 300 eV, a density cutoff 500 eV, 8 x 8 x 8 k-points and electronic temperature of 0.2 eV. The calculation is self-consistent for the PW91 functional (therefore marked (sc)) and non self-consistent for the other XC functionals.
| XC functional | Eanti-Eferro [eV] | Enon-Eferro [eV] |
|---|---|---|
| LDA | 0.856 | 0.998 |
| PW91 (sc) | 0.943 | 1.164 |
| PBE | 0.958 | 1.184 |
| revPBE | 0.974 | 1.214 |
| RPBE | 0.980 | 1.224 |
The LDA and GGA functionals find the same energetic order of the structures ferromagn. < antiferromagn. < nonmagn., but the energy differences between the phases are larger for the GGAs than for the LDA. One can see that LDA and the GGA functionals give rather different energies, whereas the results of the different GGAs are quite similar to each other.
The magnetic moment of one unit cell can be obtained by the command:
grep MOM ferro.txt
For the antiferromagnetic and nonmagnetic calculations, the magnetic moment per unit cell is zero, as expected. For the ferromagnetic structure, the magnetic moment is 2.33 μB, which compares well to the experimental value of 2.22 μB. The main reason for the difference is the convergence with respect to the number of k-points, as magnetic moments require a denser k-point sampling to converge. For more precise calculations it would be a good idea to increase the k-point sampling and also to use a higher energy cutoff.
3 Density of states (DOS)
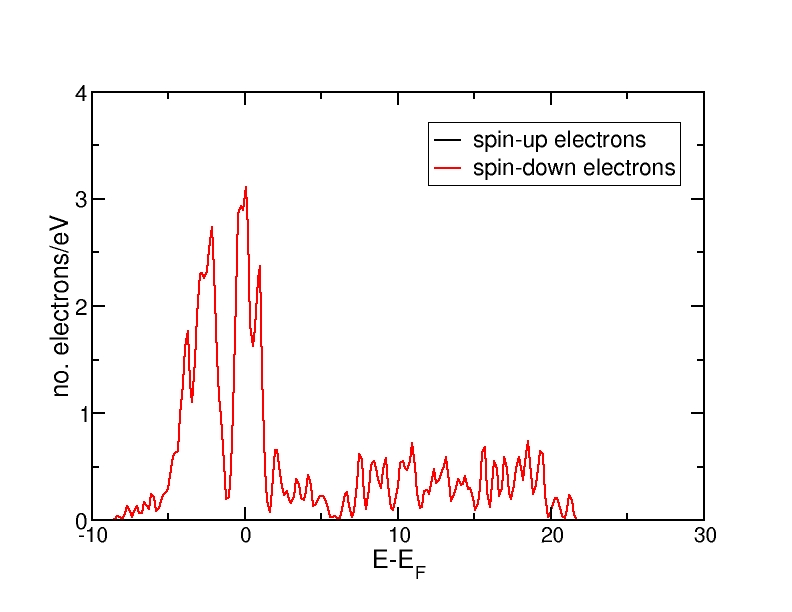
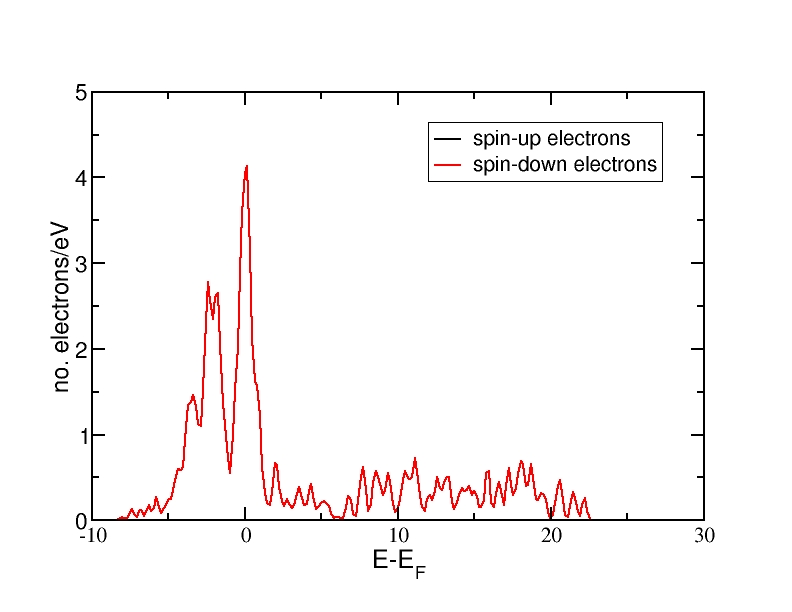
Using the script dos.py, one finds the density of states (DOS) of the three Fe configurations.
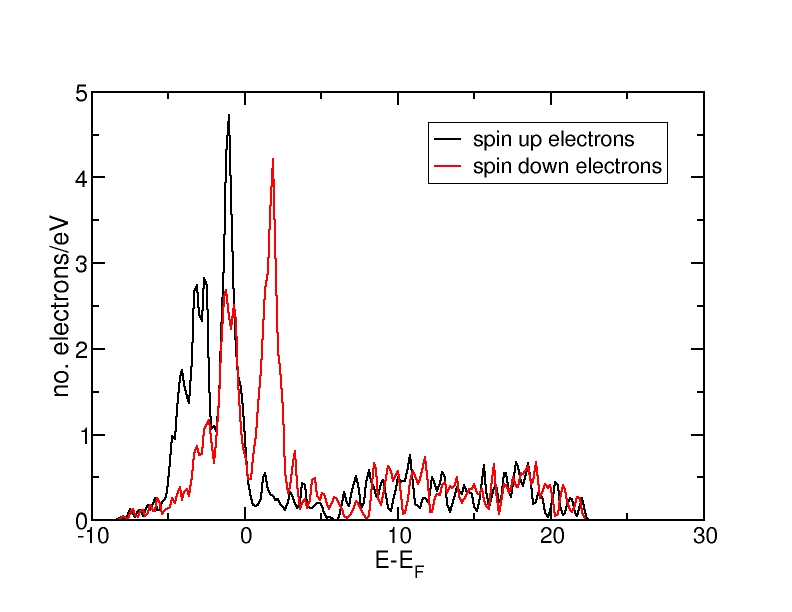
DOS for ferromagnetic Fe(bcc)
DOS for antiferromagnetic Fe(bcc)
DOS for nonmagnetic Fe(bcc)
All energies are in eV and relative to the Fermi level. The ferromagnetic structure has a net magnetic moment, as the spin-up DOS lies lower in energy than the spin-down DOS. Therefore, more electrons occupy the DOS up to the Fermi level than the spin-down DOS. The antiferromagnetic and the nonmagnetic structures do not have a net magnetic moment and therefore, the spin-up and spin-down DOS curves coincide.
The DOS curves integrate to the correct electron numbers, as e.g. can be verified by the integration tool in the program "xmgrace". The sum of the spin-up and the spin-down curves should integrate up to 16 at the Fermi level (as we have 16 valence electrons in the unit cell) and up to 34 in total (as our calculation includes 17 bands and therefore space for 34 electrons). It can be verified that all curves integrate to the correct values.
The net magnetic moment of the antiferromagnetic structure is zero. The magnetic moments, i.e. the difference in spin-up and spin-down electron density can be visualized with the script viz_Fe_anti.py.
The script is run with the command:
python -i viz_Fe_anti.py
and a VTK window with the spin density difference pops up.

The calculation for bulk aluminium is performed with the script Al-fcc.py using the experimental lattice constant a = 4.05 Å.
More k-points than in Exercise 1 are used to improve convergence. The density of states of fcc aluminium are as follows:
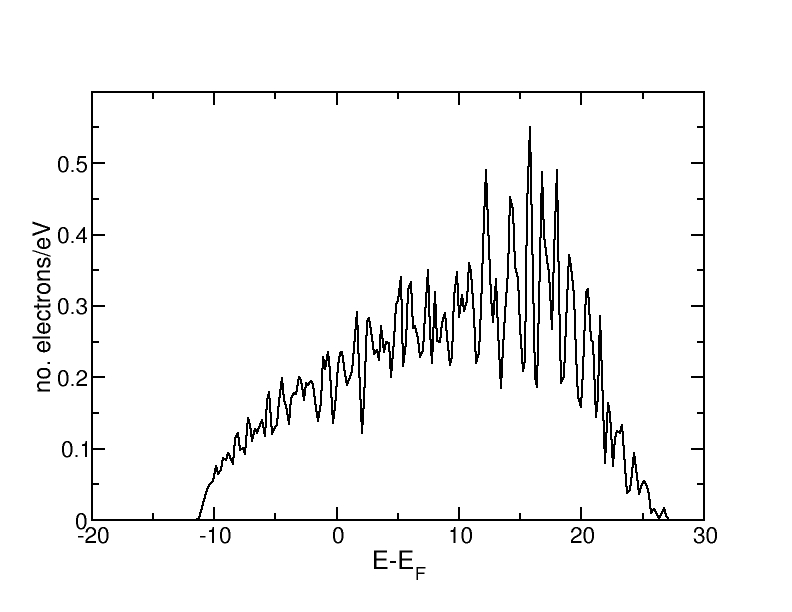
Up to the Fermi level, the curve has clearly the shape of the DOS for a simple metal g(E) ~ E1/2. Above the Fermi level, the fluctuations become larger and the DOS decreases due to the fact that we only include a finite number of electronic bands. Generally, the fluctuations are caused by the finite k-point sampling. They can be partly remedied by an appropriate choice of the Gaussian width. When generating the density of states, the discrete values from the different k-points are multiplied with a Gaussian.
Bulk silicon crystallizes in the diamond structure, which consists of two interpenetrating fcc lattices with basis at (0,0,0) and at (1/4,1/4,1/4). The calculation has been carried out with the script Si-diamond.py and the resulting density of states is shown below.
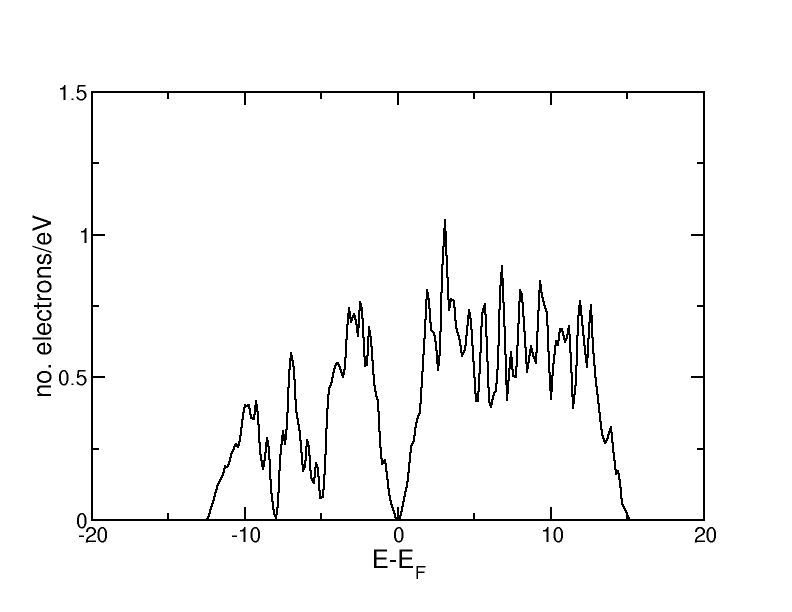
One can clearly see that there is a gap in the DOS around the Fermi level. This corresponds to the gap between valence and conduction band.
The DOS for CO can be taken from the output file from the first part of this exercise. It looks as follows:
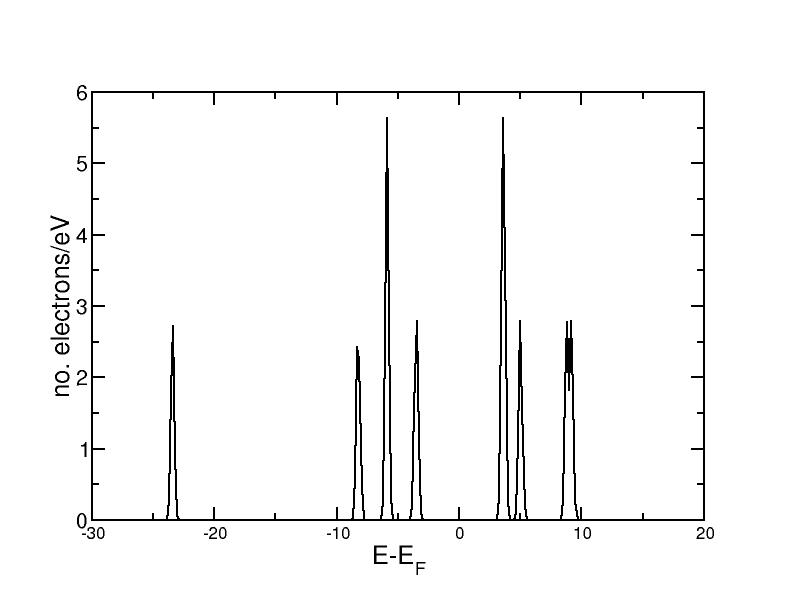
One can see the clearly seperated eigenstates. The eigenstate at -6eV and the LUMO are doubly degenerate and therefore have a higher peak.