Nudged Elastic Band calculations
Contents
1 Self-diffusion on the Al(110) surface
In this exercise, we will find minimum energy paths and transition states using the "Nudged Elastic Band" method.

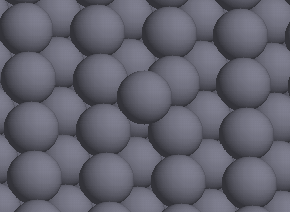
Al adatom on a Al(110) surface.
Look at the Al(110) surface in the file Al-Al110.pdb with VMD. The adatom can jump along the rows or across the rows.
- Which of the two jumps do you think will have the largest energy barrier?
The template script neb1.py will find the minimum energy path for a jump along the rows. Fill in the missing information (marked with ??) and run the script.
- Make sure you understand what is going on (make a good sketch of the 110 surface).
- What is the energy barrier?
- Copy the script to neb2.py and modify it to find the barrier for diffusion across one of the rows. What is the barrier for this process?
- Can you think of a third type of diffusion process? Hint: it is called an exchange process. Find the barrier for this process, and compare the energy barrier with the two other ones.
2 Analytical problem on transition state theory (TST)
The second problem of today's exercise is mostly an analytical one. This problem is developed by Hannes Jonsson and deals with the potential energy surface (PES) of a hydrogen atom adsorbed on a (100) crystal surface of an FCC metal.
What are the four basic assumptions of TST? What should the shape of the potential energy surface be like in order for TST to give a good approximation to the rate constant of a transition?
A hydrogen atom adsorbed on the surface of a metal crystal can diffuse by hopping from one binding site to another. The atom can be considered to be a particle moving on a periodic potential surface (PES) while the metal atoms can be taken to be stationary. This is a good first approximation because the metal atoms are so much heavier than the hydrogen atom. For a hydrogen atom on the (100) surface of an FCC metal, the potential energy of the hydrogen atom can be approximated by the function
V(x, y, z) = Vs[exp(-cos(2πx/b) - cos(2πy/b) - 2αz) - 2exp(-αz)]
For the parameters of the potential, we take Vs = 0.2 eV, b = 3 Å, α = 2 Å-1.
Identify the minima, maxima and saddle points of the PES. You may do this by either looking at the plot or taking the partial derivatives. You will need the derivatives anyway at a later point.
Plot the function with the plot program of your choice. In the following, it is described, how you can plot the potential with Mathematica. Type mathematica to start the program. Then, type:
f[x_, y_, z_] := Vs * (Exp[-Cos[2 Pi x/b]-Cos[2 Pi y/b] -2 alpha z]
                       -2 Exp[-alpha z])
To make mathematica read and evaluate this statement, press SHIFT + ENTER. You have to do this after each statement to make mathematica evaluate your statement and give you output. Then you can set the parameters by the statements:
Vs = 0.2
b = 3
alpha = 2
Then you would like a 3D contour plot of the function and type:
Plot3D[f[x, y, -1], {x, -3, 3} ,{y, -3, 3}]or:
Plot3D[f[x, 0, z], {x, -3, 3} ,{z, -1.5, 3}]Then again, press SHIFT+ENTER. Now you should see a pretty plot of the potential.
Evaluate the activation energy for diffusion hops. Then Taylor expand the potential energy about the minimum and saddle point to find the frequency of the vibrational modes and evaluate the prefactor. Add a correction to the activation energy due to zero point energy.
What is the average length of time in between diffusion hops at room temperature and at 400 K?